Readings Newsletter
Become a Readings Member to make your shopping experience even easier.
Sign in or sign up for free!
You’re not far away from qualifying for FREE standard shipping within Australia
You’ve qualified for FREE standard shipping within Australia
The cart is loading…


This title is printed to order. This book may have been self-published. If so, we cannot guarantee the quality of the content. In the main most books will have gone through the editing process however some may not. We therefore suggest that you be aware of this before ordering this book. If in doubt check either the author or publisher’s details as we are unable to accept any returns unless they are faulty. Please contact us if you have any questions.
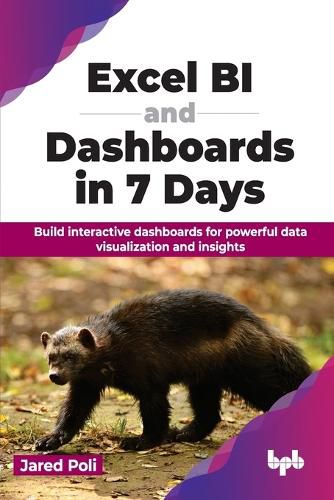
Everyone thinks of Excel differently, and its full potential is often untapped. Businesses tend to decide to invest heavily in proper BI tools, perhaps wrongfully assuming that Excel has a minimal role in that industry. Excel can be used effectively to collect, refresh, transform, and visualize your data in beautiful and eye-catching ways. This book covers building those skills and unlocking Excel and your potential in just seven days. The book explores the process of cleaning your data to ensure accuracy, using formulas to enhance and prepare the same for PivotTables. It will also help you understand how to use data visualization to create clear charts to communicate insights effectively and construct interactive dashboards for user exploration, including elements like slicers and timelines. The book also dives into discovering design principles for easy-to-understand dashboards, while gaining knowledge on maintaining and updating them for ongoing usability.
$9.00 standard shipping within Australia
FREE standard shipping within Australia for orders over $100.00
Express & International shipping calculated at checkout
This title is printed to order. This book may have been self-published. If so, we cannot guarantee the quality of the content. In the main most books will have gone through the editing process however some may not. We therefore suggest that you be aware of this before ordering this book. If in doubt check either the author or publisher’s details as we are unable to accept any returns unless they are faulty. Please contact us if you have any questions.
Everyone thinks of Excel differently, and its full potential is often untapped. Businesses tend to decide to invest heavily in proper BI tools, perhaps wrongfully assuming that Excel has a minimal role in that industry. Excel can be used effectively to collect, refresh, transform, and visualize your data in beautiful and eye-catching ways. This book covers building those skills and unlocking Excel and your potential in just seven days. The book explores the process of cleaning your data to ensure accuracy, using formulas to enhance and prepare the same for PivotTables. It will also help you understand how to use data visualization to create clear charts to communicate insights effectively and construct interactive dashboards for user exploration, including elements like slicers and timelines. The book also dives into discovering design principles for easy-to-understand dashboards, while gaining knowledge on maintaining and updating them for ongoing usability.