Readings Newsletter
Become a Readings Member to make your shopping experience even easier.
Sign in or sign up for free!
You’re not far away from qualifying for FREE standard shipping within Australia
You’ve qualified for FREE standard shipping within Australia
The cart is loading…


This title is printed to order. This book may have been self-published. If so, we cannot guarantee the quality of the content. In the main most books will have gone through the editing process however some may not. We therefore suggest that you be aware of this before ordering this book. If in doubt check either the author or publisher’s details as we are unable to accept any returns unless they are faulty. Please contact us if you have any questions.
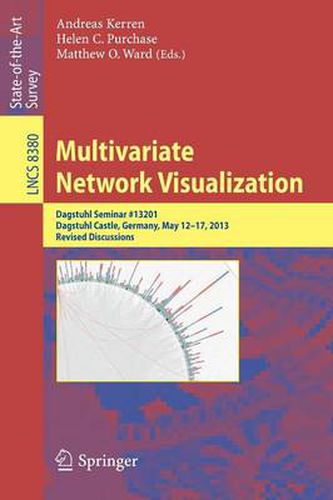
This book is the outcome of the Dagstuhl Seminar 13201 on Information Visualization - Towards Multivariate Network Visualization, held in Dagstuhl Castle, Germany in May 2013. The goal of this Dagstuhl Seminar was to bring together theoreticians and practitioners from Information Visualization, HCI and Graph Drawing with a special focus on multivariate network visualization, i.e., on graphs where the nodes and/or edges have additional (multidimensional) attributes. The integration of multivariate data into complex networks and their visual analysis is one of the big challenges not only in visualization, but also in many application areas. Thus, in order to support discussions related to the visualization of real world data, also invited researchers from selected application areas, especially bioinformatics, social sciences and software engineering. The unique Dagstuhl climate ensured an open and undisturbed atmosphere to discuss the state-of-the-art, new directions and open challenges of multivariate network visualization.
$9.00 standard shipping within Australia
FREE standard shipping within Australia for orders over $100.00
Express & International shipping calculated at checkout
This title is printed to order. This book may have been self-published. If so, we cannot guarantee the quality of the content. In the main most books will have gone through the editing process however some may not. We therefore suggest that you be aware of this before ordering this book. If in doubt check either the author or publisher’s details as we are unable to accept any returns unless they are faulty. Please contact us if you have any questions.
This book is the outcome of the Dagstuhl Seminar 13201 on Information Visualization - Towards Multivariate Network Visualization, held in Dagstuhl Castle, Germany in May 2013. The goal of this Dagstuhl Seminar was to bring together theoreticians and practitioners from Information Visualization, HCI and Graph Drawing with a special focus on multivariate network visualization, i.e., on graphs where the nodes and/or edges have additional (multidimensional) attributes. The integration of multivariate data into complex networks and their visual analysis is one of the big challenges not only in visualization, but also in many application areas. Thus, in order to support discussions related to the visualization of real world data, also invited researchers from selected application areas, especially bioinformatics, social sciences and software engineering. The unique Dagstuhl climate ensured an open and undisturbed atmosphere to discuss the state-of-the-art, new directions and open challenges of multivariate network visualization.