Readings Newsletter
Become a Readings Member to make your shopping experience even easier.
Sign in or sign up for free!
You’re not far away from qualifying for FREE standard shipping within Australia
You’ve qualified for FREE standard shipping within Australia
The cart is loading…


This title is printed to order. This book may have been self-published. If so, we cannot guarantee the quality of the content. In the main most books will have gone through the editing process however some may not. We therefore suggest that you be aware of this before ordering this book. If in doubt check either the author or publisher’s details as we are unable to accept any returns unless they are faulty. Please contact us if you have any questions.
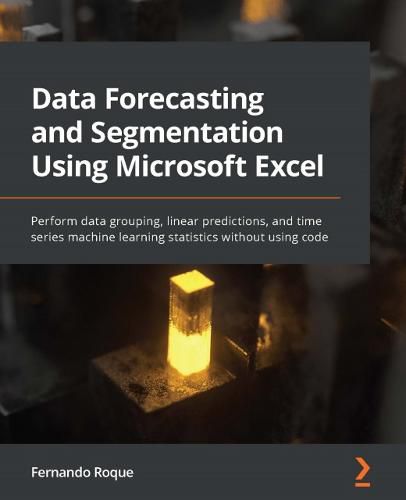
Perform time series forecasts, linear prediction, and data segmentation with no-code Excel machine learning
Key Features
Segment data, regression predictions, and time series forecasts without writing any code Group multiple variables with K-means using Excel plugin without programming Build, validate, and predict with a multiple linear regression model and time series forecasts
Book DescriptionData Forecasting and Segmentation Using Microsoft Excel guides you through basic statistics to test whether your data can be used to perform regression predictions and time series forecasts. The exercises covered in this book use real-life data from Kaggle, such as demand for seasonal air tickets and credit card fraud detection.
You’ll learn how to apply the grouping K-means algorithm, which helps you find segments of your data that are impossible to see with other analyses, such as business intelligence (BI) and pivot analysis. By analyzing groups returned by K-means, you’ll be able to detect outliers that could indicate possible fraud or a bad function in network packets.
By the end of this Microsoft Excel book, you’ll be able to use the classification algorithm to group data with different variables. You’ll also be able to train linear and time series models to perform predictions and forecasts based on past data.
What you will learn
Understand why machine learning is important for classifying data segmentation Focus on basic statistics tests for regression variable dependency Test time series autocorrelation to build a useful forecast Use Excel add-ins to run K-means without programming Analyze segment outliers for possible data anomalies and fraud Build, train, and validate multiple regression models and time series forecasts
Who this book is forThis book is for data and business analysts as well as data science professionals. MIS, finance, and auditing professionals working with MS Excel will also find this book beneficial.
$9.00 standard shipping within Australia
FREE standard shipping within Australia for orders over $100.00
Express & International shipping calculated at checkout
This title is printed to order. This book may have been self-published. If so, we cannot guarantee the quality of the content. In the main most books will have gone through the editing process however some may not. We therefore suggest that you be aware of this before ordering this book. If in doubt check either the author or publisher’s details as we are unable to accept any returns unless they are faulty. Please contact us if you have any questions.
Perform time series forecasts, linear prediction, and data segmentation with no-code Excel machine learning
Key Features
Segment data, regression predictions, and time series forecasts without writing any code Group multiple variables with K-means using Excel plugin without programming Build, validate, and predict with a multiple linear regression model and time series forecasts
Book DescriptionData Forecasting and Segmentation Using Microsoft Excel guides you through basic statistics to test whether your data can be used to perform regression predictions and time series forecasts. The exercises covered in this book use real-life data from Kaggle, such as demand for seasonal air tickets and credit card fraud detection.
You’ll learn how to apply the grouping K-means algorithm, which helps you find segments of your data that are impossible to see with other analyses, such as business intelligence (BI) and pivot analysis. By analyzing groups returned by K-means, you’ll be able to detect outliers that could indicate possible fraud or a bad function in network packets.
By the end of this Microsoft Excel book, you’ll be able to use the classification algorithm to group data with different variables. You’ll also be able to train linear and time series models to perform predictions and forecasts based on past data.
What you will learn
Understand why machine learning is important for classifying data segmentation Focus on basic statistics tests for regression variable dependency Test time series autocorrelation to build a useful forecast Use Excel add-ins to run K-means without programming Analyze segment outliers for possible data anomalies and fraud Build, train, and validate multiple regression models and time series forecasts
Who this book is forThis book is for data and business analysts as well as data science professionals. MIS, finance, and auditing professionals working with MS Excel will also find this book beneficial.