Readings Newsletter
Become a Readings Member to make your shopping experience even easier.
Sign in or sign up for free!
You’re not far away from qualifying for FREE standard shipping within Australia
You’ve qualified for FREE standard shipping within Australia
The cart is loading…


This title is printed to order. This book may have been self-published. If so, we cannot guarantee the quality of the content. In the main most books will have gone through the editing process however some may not. We therefore suggest that you be aware of this before ordering this book. If in doubt check either the author or publisher’s details as we are unable to accept any returns unless they are faulty. Please contact us if you have any questions.
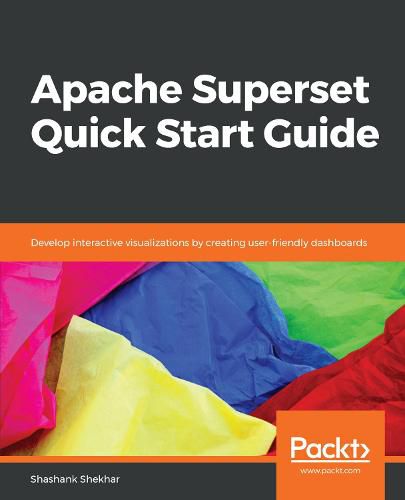
Integrate open source data analytics and build business intelligence on SQL databases with Apache Superset. The quick, intuitive nature for data visualization in a web application makes it easy for creating interactive dashboards.
Key Features
Work with Apache Superset’s rich set of data visualizations Create interactive dashboards and data storytelling Easily explore data
Book DescriptionApache Superset is a modern, open source, enterprise-ready business intelligence (BI) web application. With the help of this book, you will see how Superset integrates with popular databases like Postgres, Google BigQuery, Snowflake, and MySQL. You will learn to create real time data visualizations and dashboards on modern web browsers for your organization using Superset.
First, we look at the fundamentals of Superset, and then get it up and running. You’ll go through the requisite installation, configuration, and deployment. Then, we will discuss different columnar data types, analytics, and the visualizations available. You’ll also see the security tools available to the administrator to keep your data safe.
You will learn how to visualize relationships as graphs instead of coordinates on plain orthogonal axes. This will help you when you upload your own entity relationship dataset and analyze the dataset in new, different ways. You will also see how to analyze geographical regions by working with location data.
Finally, we cover a set of tutorials on dashboard designs frequently used by analysts, business intelligence professionals, and developers.
What you will learn
Get to grips with the fundamentals of data exploration using Superset Set up a working instance of Superset on cloud services like Google Compute Engine Integrate Superset with SQL databases Build dashboards with Superset Calculate statistics in Superset for numerical, categorical, or text data Understand visualization techniques, filtering, and grouping by aggregation Manage user roles and permissions in Superset Work with SQL Lab
Who this book is forThis book is for data analysts, BI professionals, and developers who want to learn Apache Superset. If you want to create interactive dashboards from SQL databases, this book is what you need. Working knowledge of Python will be an advantage but not necessary to understand this book.
$9.00 standard shipping within Australia
FREE standard shipping within Australia for orders over $100.00
Express & International shipping calculated at checkout
This title is printed to order. This book may have been self-published. If so, we cannot guarantee the quality of the content. In the main most books will have gone through the editing process however some may not. We therefore suggest that you be aware of this before ordering this book. If in doubt check either the author or publisher’s details as we are unable to accept any returns unless they are faulty. Please contact us if you have any questions.
Integrate open source data analytics and build business intelligence on SQL databases with Apache Superset. The quick, intuitive nature for data visualization in a web application makes it easy for creating interactive dashboards.
Key Features
Work with Apache Superset’s rich set of data visualizations Create interactive dashboards and data storytelling Easily explore data
Book DescriptionApache Superset is a modern, open source, enterprise-ready business intelligence (BI) web application. With the help of this book, you will see how Superset integrates with popular databases like Postgres, Google BigQuery, Snowflake, and MySQL. You will learn to create real time data visualizations and dashboards on modern web browsers for your organization using Superset.
First, we look at the fundamentals of Superset, and then get it up and running. You’ll go through the requisite installation, configuration, and deployment. Then, we will discuss different columnar data types, analytics, and the visualizations available. You’ll also see the security tools available to the administrator to keep your data safe.
You will learn how to visualize relationships as graphs instead of coordinates on plain orthogonal axes. This will help you when you upload your own entity relationship dataset and analyze the dataset in new, different ways. You will also see how to analyze geographical regions by working with location data.
Finally, we cover a set of tutorials on dashboard designs frequently used by analysts, business intelligence professionals, and developers.
What you will learn
Get to grips with the fundamentals of data exploration using Superset Set up a working instance of Superset on cloud services like Google Compute Engine Integrate Superset with SQL databases Build dashboards with Superset Calculate statistics in Superset for numerical, categorical, or text data Understand visualization techniques, filtering, and grouping by aggregation Manage user roles and permissions in Superset Work with SQL Lab
Who this book is forThis book is for data analysts, BI professionals, and developers who want to learn Apache Superset. If you want to create interactive dashboards from SQL databases, this book is what you need. Working knowledge of Python will be an advantage but not necessary to understand this book.