Readings Newsletter
Become a Readings Member to make your shopping experience even easier.
Sign in or sign up for free!
You’re not far away from qualifying for FREE standard shipping within Australia
You’ve qualified for FREE standard shipping within Australia
The cart is loading…


This title is printed to order. This book may have been self-published. If so, we cannot guarantee the quality of the content. In the main most books will have gone through the editing process however some may not. We therefore suggest that you be aware of this before ordering this book. If in doubt check either the author or publisher’s details as we are unable to accept any returns unless they are faulty. Please contact us if you have any questions.
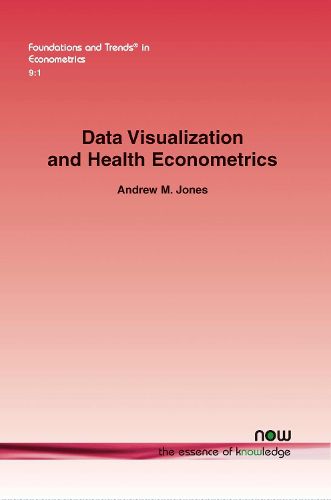
Econometric models for health outcomes and health care costs are used for prediction and forecasting in health care planning, risk adjustment by insurers and public providers of health care, geographic resource allocation, health technology assessment and health policy impact evaluations. Methods for risk adjustment focus on predicting the treatment costs for a particular type of patient, often with very large survey or administrative datasets. Data Visualization and Health Econometrics focuses on the principles and practice of data visualization and statistical graphics and how these can enhance empirical analysis of health care costs and outcomes, especially for skewed and heavy-tailed distributions. The scope of this review is limited to non-normal but continuous outcomes such as health care costs and biomarkers. The methods and applications used here are limited to cross sectional data. The review of methods that have been developed for health care cost regressions is complemented by an empirical case study that focuses on objectively measured health outcomes, whose distributions share many of the features of cost data. The case study applies the econometric and graphical methods to blood-based biomarkers as the dependent variables.
$9.00 standard shipping within Australia
FREE standard shipping within Australia for orders over $100.00
Express & International shipping calculated at checkout
Stock availability can be subject to change without notice. We recommend calling the shop or contacting our online team to check availability of low stock items. Please see our Shopping Online page for more details.
This title is printed to order. This book may have been self-published. If so, we cannot guarantee the quality of the content. In the main most books will have gone through the editing process however some may not. We therefore suggest that you be aware of this before ordering this book. If in doubt check either the author or publisher’s details as we are unable to accept any returns unless they are faulty. Please contact us if you have any questions.
Econometric models for health outcomes and health care costs are used for prediction and forecasting in health care planning, risk adjustment by insurers and public providers of health care, geographic resource allocation, health technology assessment and health policy impact evaluations. Methods for risk adjustment focus on predicting the treatment costs for a particular type of patient, often with very large survey or administrative datasets. Data Visualization and Health Econometrics focuses on the principles and practice of data visualization and statistical graphics and how these can enhance empirical analysis of health care costs and outcomes, especially for skewed and heavy-tailed distributions. The scope of this review is limited to non-normal but continuous outcomes such as health care costs and biomarkers. The methods and applications used here are limited to cross sectional data. The review of methods that have been developed for health care cost regressions is complemented by an empirical case study that focuses on objectively measured health outcomes, whose distributions share many of the features of cost data. The case study applies the econometric and graphical methods to blood-based biomarkers as the dependent variables.