Readings Newsletter
Become a Readings Member to make your shopping experience even easier.
Sign in or sign up for free!
You’re not far away from qualifying for FREE standard shipping within Australia
You’ve qualified for FREE standard shipping within Australia
The cart is loading…


This title is printed to order. This book may have been self-published. If so, we cannot guarantee the quality of the content. In the main most books will have gone through the editing process however some may not. We therefore suggest that you be aware of this before ordering this book. If in doubt check either the author or publisher’s details as we are unable to accept any returns unless they are faulty. Please contact us if you have any questions.
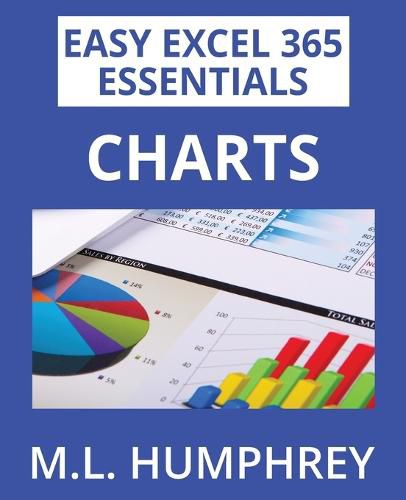
Charts are a great way to visualize data. Sometimes numbers can be overwhelming, but a quick picture based on those numbers makes trends and patterns very clear.
This book covers how to work with charts in Excel on a general basis as well as some of the more popular chart types, specifically bar and column charts, pie and doughnut charts, line and area charts, scatter and bubble plots, and histograms.
This book is part of the Easy Excel 365 Essentials series of titles. These are targeted titles that are excerpted from the main Excel 365 Essentials series and are focused on one specific topic.
If you want a more general introduction to Excel, then you should check out the Excel 365 Essentials titles instead. In this case, Intermediate Excel 365 which covers charts as well as a number of other topics, such as pivot tables and conditional formatting.
$9.00 standard shipping within Australia
FREE standard shipping within Australia for orders over $100.00
Express & International shipping calculated at checkout
This title is printed to order. This book may have been self-published. If so, we cannot guarantee the quality of the content. In the main most books will have gone through the editing process however some may not. We therefore suggest that you be aware of this before ordering this book. If in doubt check either the author or publisher’s details as we are unable to accept any returns unless they are faulty. Please contact us if you have any questions.
Charts are a great way to visualize data. Sometimes numbers can be overwhelming, but a quick picture based on those numbers makes trends and patterns very clear.
This book covers how to work with charts in Excel on a general basis as well as some of the more popular chart types, specifically bar and column charts, pie and doughnut charts, line and area charts, scatter and bubble plots, and histograms.
This book is part of the Easy Excel 365 Essentials series of titles. These are targeted titles that are excerpted from the main Excel 365 Essentials series and are focused on one specific topic.
If you want a more general introduction to Excel, then you should check out the Excel 365 Essentials titles instead. In this case, Intermediate Excel 365 which covers charts as well as a number of other topics, such as pivot tables and conditional formatting.
Search our extensive online catalogue.
