Readings Newsletter
Become a Readings Member to make your shopping experience even easier.
Sign in or sign up for free!
You’re not far away from qualifying for FREE standard shipping within Australia
You’ve qualified for FREE standard shipping within Australia
The cart is loading…


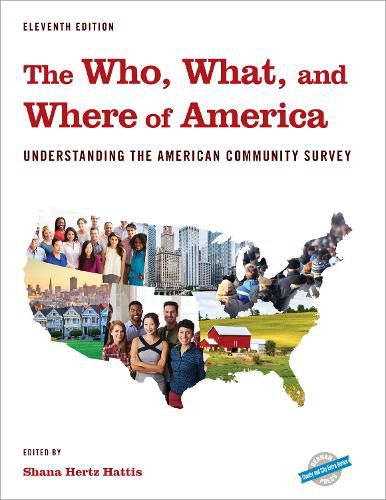
The Who, What, and Where of America is designed to provide a sampling of key demographic information. It covers the United States, every state, each metropolitan statistical area, and all the counties and cities with a population of 20,000 or more.
Who: Age, Race and Ethnicity, and Household Structure What: Education, Employment, and Income Where: Migration, Housing, and Transportation
Each part is preceded by highlights and ranking tables that show how areas diverge from the national norm. These research aids are invaluable for understanding data from the ACS and for highlighting what it tells us about who we are, what we do, and where we live.
Each topic is divided into four tables revealing the results of the data collected from different types of geographic areas in the United States, generally with populations greater than 20,000.
Table A. States Table B. Counties Table C. Metropolitan Areas Table D. Cities
$9.00 standard shipping within Australia
FREE standard shipping within Australia for orders over $100.00
Express & International shipping calculated at checkout
The Who, What, and Where of America is designed to provide a sampling of key demographic information. It covers the United States, every state, each metropolitan statistical area, and all the counties and cities with a population of 20,000 or more.
Who: Age, Race and Ethnicity, and Household Structure What: Education, Employment, and Income Where: Migration, Housing, and Transportation
Each part is preceded by highlights and ranking tables that show how areas diverge from the national norm. These research aids are invaluable for understanding data from the ACS and for highlighting what it tells us about who we are, what we do, and where we live.
Each topic is divided into four tables revealing the results of the data collected from different types of geographic areas in the United States, generally with populations greater than 20,000.
Table A. States Table B. Counties Table C. Metropolitan Areas Table D. Cities