Readings Newsletter
Become a Readings Member to make your shopping experience even easier.
Sign in or sign up for free!
You’re not far away from qualifying for FREE standard shipping within Australia
You’ve qualified for FREE standard shipping within Australia
The cart is loading…


One of the six best books for data geeks - Financial Times
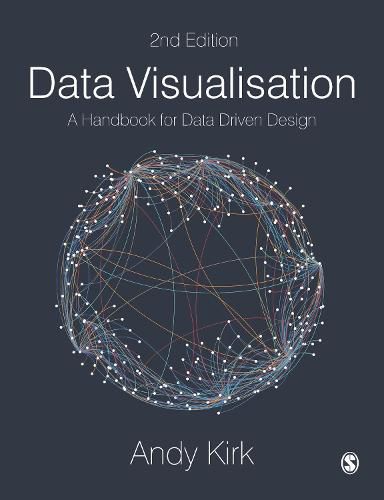
With over 200 images and extensive how-to and how-not-to examples, this new edition has everything students and scholars need to understand and create effective data visualisations.
Combining ‘how to think’ instruction with a ‘how to produce’ mentality, this book takes readers step-by-step through analysing, designing, and curating information into useful, impactful tools of communication.
With this book and its extensive collection of online support, readers can:
Decide what visualisations work best for their data and their audience using the chart gallery See data visualisation in action and learn the tools to try it themselves Follow online checklists, tutorials, and exercises to build skills and confidence Get advice from the UK’s leading data visualisation trainer on everything from getting started to honing the craft.
$9.00 standard shipping within Australia
FREE standard shipping within Australia for orders over $100.00
Express & International shipping calculated at checkout
One of the six best books for data geeks - Financial Times
With over 200 images and extensive how-to and how-not-to examples, this new edition has everything students and scholars need to understand and create effective data visualisations.
Combining ‘how to think’ instruction with a ‘how to produce’ mentality, this book takes readers step-by-step through analysing, designing, and curating information into useful, impactful tools of communication.
With this book and its extensive collection of online support, readers can:
Decide what visualisations work best for their data and their audience using the chart gallery See data visualisation in action and learn the tools to try it themselves Follow online checklists, tutorials, and exercises to build skills and confidence Get advice from the UK’s leading data visualisation trainer on everything from getting started to honing the craft.