Readings Newsletter
Become a Readings Member to make your shopping experience even easier.
Sign in or sign up for free!
You’re not far away from qualifying for FREE standard shipping within Australia
You’ve qualified for FREE standard shipping within Australia
The cart is loading…


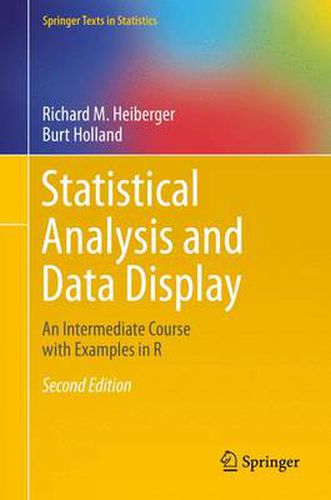
This contemporary presentation of statistical methods features extensive use of graphical displays for exploring data and for displaying the analysis. The authors demonstrate how to analyze data-showing code, graphics, and accompanying tabular listings-for all the methods they cover. Complete R scripts for all examples and figures are provided for readers to use as models for their own analyses.
This book can serve as a standalone text for statistics majors at the master’s level and for other quantitatively oriented disciplines at the doctoral level, and as a reference book for researchers. Classical concepts and techniques are illustrated with a variety of case studies using both newer graphical tools and traditional tabular displays.
New graphical material includes:
an expanded chapter on graphics
a section on graphing Likert Scale Data to build on the importance of rating scales in fields from population studies to psychometrics
a discussion on design of graphics that will work for readers with color-deficient vision
an expanded discussion on the design of multi-panel graphics
expanded and new sections in the discrete bivariate statistics capter on the use of mosaic plots for contingency tables including the nx2x2 tables for which the Mantel-Haenszel-Cochran test is appropriate
an interactive (using the shiny package) presentation of the graphics for the normal and t-tables that is introduced early and used in many chapters
$9.00 standard shipping within Australia
FREE standard shipping within Australia for orders over $100.00
Express & International shipping calculated at checkout
This contemporary presentation of statistical methods features extensive use of graphical displays for exploring data and for displaying the analysis. The authors demonstrate how to analyze data-showing code, graphics, and accompanying tabular listings-for all the methods they cover. Complete R scripts for all examples and figures are provided for readers to use as models for their own analyses.
This book can serve as a standalone text for statistics majors at the master’s level and for other quantitatively oriented disciplines at the doctoral level, and as a reference book for researchers. Classical concepts and techniques are illustrated with a variety of case studies using both newer graphical tools and traditional tabular displays.
New graphical material includes:
an expanded chapter on graphics
a section on graphing Likert Scale Data to build on the importance of rating scales in fields from population studies to psychometrics
a discussion on design of graphics that will work for readers with color-deficient vision
an expanded discussion on the design of multi-panel graphics
expanded and new sections in the discrete bivariate statistics capter on the use of mosaic plots for contingency tables including the nx2x2 tables for which the Mantel-Haenszel-Cochran test is appropriate
an interactive (using the shiny package) presentation of the graphics for the normal and t-tables that is introduced early and used in many chapters