Readings Newsletter
Become a Readings Member to make your shopping experience even easier.
Sign in or sign up for free!
You’re not far away from qualifying for FREE standard shipping within Australia
You’ve qualified for FREE standard shipping within Australia
The cart is loading…


This title is printed to order. This book may have been self-published. If so, we cannot guarantee the quality of the content. In the main most books will have gone through the editing process however some may not. We therefore suggest that you be aware of this before ordering this book. If in doubt check either the author or publisher’s details as we are unable to accept any returns unless they are faulty. Please contact us if you have any questions.
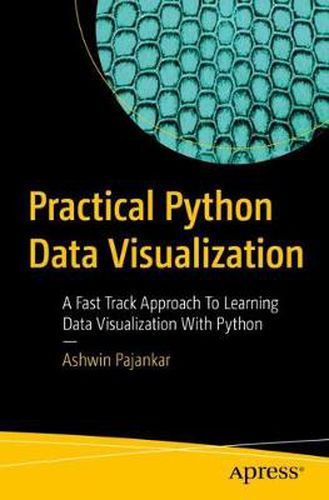
Quickly start programming with Python 3 for data visualization with this step-by-step, detailed guide. This book’s programming-friendly approach using libraries such as leather, NumPy, Matplotlib, and Pandas will serve as a template for business and scientific visualizations.
You’ll begin by installing Python 3, see how to work in Jupyter notebook, and explore Leather, Python’s popular data visualization charting library. You’ll also be introduced to the scientific Python 3 ecosystem and work with the basics of NumPy, an integral part of that ecosystem. Later chapters are focused on various NumPy routines along with getting started with Scientific Data visualization using matplotlib. You’ll review the visualization of 3D data using graphs and networks and finish up by looking at data visualization with Pandas, including the visualization of COVID-19 data sets.
The code examples are tested on popular platforms like Ubuntu, Windows, and Raspberry Pi OS. With Practical Python Data Visualization you’ll master the core concepts of data visualization with Pandas and the Jupyter notebook interface.
What You’ll Learn
Review practical aspects of Python Data Visualization with programming-friendly abstractions
Install Python 3 and Jupyter on multiple platforms including Windows, Raspberry Pi, and Ubuntu
Visualize COVID-19 data sets with Pandas
Who This Book Is For Data Science enthusiasts and professionals, Business analysts and managers, software engineers, data engineers.
$9.00 standard shipping within Australia
FREE standard shipping within Australia for orders over $100.00
Express & International shipping calculated at checkout
This title is printed to order. This book may have been self-published. If so, we cannot guarantee the quality of the content. In the main most books will have gone through the editing process however some may not. We therefore suggest that you be aware of this before ordering this book. If in doubt check either the author or publisher’s details as we are unable to accept any returns unless they are faulty. Please contact us if you have any questions.
Quickly start programming with Python 3 for data visualization with this step-by-step, detailed guide. This book’s programming-friendly approach using libraries such as leather, NumPy, Matplotlib, and Pandas will serve as a template for business and scientific visualizations.
You’ll begin by installing Python 3, see how to work in Jupyter notebook, and explore Leather, Python’s popular data visualization charting library. You’ll also be introduced to the scientific Python 3 ecosystem and work with the basics of NumPy, an integral part of that ecosystem. Later chapters are focused on various NumPy routines along with getting started with Scientific Data visualization using matplotlib. You’ll review the visualization of 3D data using graphs and networks and finish up by looking at data visualization with Pandas, including the visualization of COVID-19 data sets.
The code examples are tested on popular platforms like Ubuntu, Windows, and Raspberry Pi OS. With Practical Python Data Visualization you’ll master the core concepts of data visualization with Pandas and the Jupyter notebook interface.
What You’ll Learn
Review practical aspects of Python Data Visualization with programming-friendly abstractions
Install Python 3 and Jupyter on multiple platforms including Windows, Raspberry Pi, and Ubuntu
Visualize COVID-19 data sets with Pandas
Who This Book Is For Data Science enthusiasts and professionals, Business analysts and managers, software engineers, data engineers.