Readings Newsletter
Become a Readings Member to make your shopping experience even easier.
Sign in or sign up for free!
You’re not far away from qualifying for FREE standard shipping within Australia
You’ve qualified for FREE standard shipping within Australia
The cart is loading…


This title is printed to order. This book may have been self-published. If so, we cannot guarantee the quality of the content. In the main most books will have gone through the editing process however some may not. We therefore suggest that you be aware of this before ordering this book. If in doubt check either the author or publisher’s details as we are unable to accept any returns unless they are faulty. Please contact us if you have any questions.
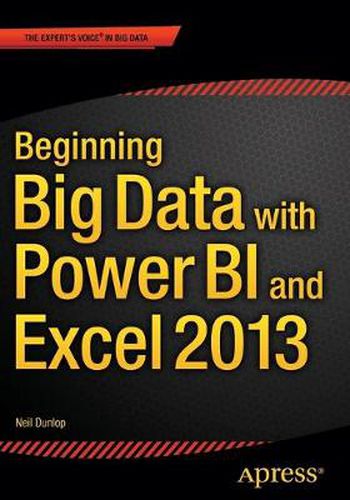
In Beginning Big Data with Power BI and Excel 2013, you will learn to solve business problems by tapping the power of Microsoft’s Excel and Power BI to import data from NoSQL and SQL databases and other sources, create relational data models, and analyze business problems through sophisticated dashboards and data-driven maps.
While Beginning Big Data with Power BI and Excel 2013 covers prominent tools such as Hadoop and the NoSQL databases, it recognizes that most small and medium-sized businesses don’t have the Big Data processing needs of a Netflix, Target, or Facebook. Instead, it shows how to import data and use the self-service analytics available in Excel with Power BI. As you’ll see through the book’s numerous case examples, these tools-which you already know how to use-can perform many of the same functions as the higher-end Apache tools many people believe are required to carry out in Big Data projects.
Through instruction, insight, advice, and case studies, Beginning Big Data with Power BI and Excel 2013 will show you how to:
Import and mash up data from web pages, SQL and NoSQL databases, the Azure Marketplace and other sources. Tap
into the analytical power of PivotTables and PivotCharts and develop
relational data models to track trends and make predictions based on a
wide range of data. Understand basic statistics and use Excel
with PowerBI to do sophisticated statistical analysis-including
identifying trends and correlations. Use SQL within Excel to do sophisticated queries across multiple tables, including NoSQL databases. Create complex formulas to solve real-world business problems using Data Analysis Expressions (DAX).
$9.00 standard shipping within Australia
FREE standard shipping within Australia for orders over $100.00
Express & International shipping calculated at checkout
This title is printed to order. This book may have been self-published. If so, we cannot guarantee the quality of the content. In the main most books will have gone through the editing process however some may not. We therefore suggest that you be aware of this before ordering this book. If in doubt check either the author or publisher’s details as we are unable to accept any returns unless they are faulty. Please contact us if you have any questions.
In Beginning Big Data with Power BI and Excel 2013, you will learn to solve business problems by tapping the power of Microsoft’s Excel and Power BI to import data from NoSQL and SQL databases and other sources, create relational data models, and analyze business problems through sophisticated dashboards and data-driven maps.
While Beginning Big Data with Power BI and Excel 2013 covers prominent tools such as Hadoop and the NoSQL databases, it recognizes that most small and medium-sized businesses don’t have the Big Data processing needs of a Netflix, Target, or Facebook. Instead, it shows how to import data and use the self-service analytics available in Excel with Power BI. As you’ll see through the book’s numerous case examples, these tools-which you already know how to use-can perform many of the same functions as the higher-end Apache tools many people believe are required to carry out in Big Data projects.
Through instruction, insight, advice, and case studies, Beginning Big Data with Power BI and Excel 2013 will show you how to:
Import and mash up data from web pages, SQL and NoSQL databases, the Azure Marketplace and other sources. Tap
into the analytical power of PivotTables and PivotCharts and develop
relational data models to track trends and make predictions based on a
wide range of data. Understand basic statistics and use Excel
with PowerBI to do sophisticated statistical analysis-including
identifying trends and correlations. Use SQL within Excel to do sophisticated queries across multiple tables, including NoSQL databases. Create complex formulas to solve real-world business problems using Data Analysis Expressions (DAX).