Readings Newsletter
Become a Readings Member to make your shopping experience even easier.
Sign in or sign up for free!
You’re not far away from qualifying for FREE standard shipping within Australia
You’ve qualified for FREE standard shipping within Australia
The cart is loading…


This title is printed to order. This book may have been self-published. If so, we cannot guarantee the quality of the content. In the main most books will have gone through the editing process however some may not. We therefore suggest that you be aware of this before ordering this book. If in doubt check either the author or publisher’s details as we are unable to accept any returns unless they are faulty. Please contact us if you have any questions.
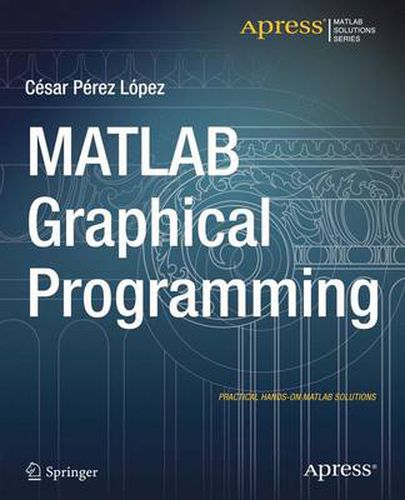
MATLAB enables you to work with its graphics capabilities in almost all areas of the experimental sciences and engineering. The commands that MATLAB implements in job related graphics are quite useful and are very efficient.
MATLAB has functions for working with two-dimensional and three-dimensional graphics, statistical graphs, curves and surfaces in explicit, implicit, parametric and polar coordinates. It also works perfectly with twisted curves, surfaces, volumes and graphical interpolation. MATLAB Graphical Programming addresses all these issues by developing the following topics:This book is a reference designed to give you a simple syntax example of the commands and to graph it so that you can see the result for:
$9.00 standard shipping within Australia
FREE standard shipping within Australia for orders over $100.00
Express & International shipping calculated at checkout
This title is printed to order. This book may have been self-published. If so, we cannot guarantee the quality of the content. In the main most books will have gone through the editing process however some may not. We therefore suggest that you be aware of this before ordering this book. If in doubt check either the author or publisher’s details as we are unable to accept any returns unless they are faulty. Please contact us if you have any questions.
MATLAB enables you to work with its graphics capabilities in almost all areas of the experimental sciences and engineering. The commands that MATLAB implements in job related graphics are quite useful and are very efficient.
MATLAB has functions for working with two-dimensional and three-dimensional graphics, statistical graphs, curves and surfaces in explicit, implicit, parametric and polar coordinates. It also works perfectly with twisted curves, surfaces, volumes and graphical interpolation. MATLAB Graphical Programming addresses all these issues by developing the following topics:This book is a reference designed to give you a simple syntax example of the commands and to graph it so that you can see the result for: