Readings Newsletter
Become a Readings Member to make your shopping experience even easier.
Sign in or sign up for free!
You’re not far away from qualifying for FREE standard shipping within Australia
You’ve qualified for FREE standard shipping within Australia
The cart is loading…


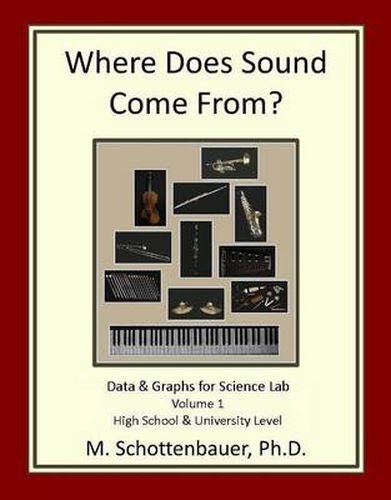
In this book, readers gain access to real scientific data pertaining to the science of sound production, promoting graph-reading, comparison, contrast, and calculation skills. Graphs show data from a Gas Pressure Sensor, Anemometer (Wind Speed), Dual-Range Force Sensor, and Sound Pressure Meter (Microphone). The musical instruments analyzed include violin, flute, clarinet, saxophone, oboe and bassoon reeds, trumpet, trombone, 5 types of recorders (garklein, sopranino, soprano, alto, tenor, and bass), xylophone, drum pad, cymbals, gong, maracas, guiro, claves, triangle, maracas, wood block, castanets, Tibetan bowl, tuning fork, and voice. Bonus Material: Graphs of data for different types of microphone setups (mono, stereo, traditional stereo, &, x-y configuration), graphs of theoretically calculated harmonic waves, and selected instrument measurement specifications are included. Plus, graphs from a simple pneumatic experiment provide contrast and context for the science of music.
$9.00 standard shipping within Australia
FREE standard shipping within Australia for orders over $100.00
Express & International shipping calculated at checkout
In this book, readers gain access to real scientific data pertaining to the science of sound production, promoting graph-reading, comparison, contrast, and calculation skills. Graphs show data from a Gas Pressure Sensor, Anemometer (Wind Speed), Dual-Range Force Sensor, and Sound Pressure Meter (Microphone). The musical instruments analyzed include violin, flute, clarinet, saxophone, oboe and bassoon reeds, trumpet, trombone, 5 types of recorders (garklein, sopranino, soprano, alto, tenor, and bass), xylophone, drum pad, cymbals, gong, maracas, guiro, claves, triangle, maracas, wood block, castanets, Tibetan bowl, tuning fork, and voice. Bonus Material: Graphs of data for different types of microphone setups (mono, stereo, traditional stereo, &, x-y configuration), graphs of theoretically calculated harmonic waves, and selected instrument measurement specifications are included. Plus, graphs from a simple pneumatic experiment provide contrast and context for the science of music.