Readings Newsletter
Become a Readings Member to make your shopping experience even easier.
Sign in or sign up for free!
You’re not far away from qualifying for FREE standard shipping within Australia
You’ve qualified for FREE standard shipping within Australia
The cart is loading…


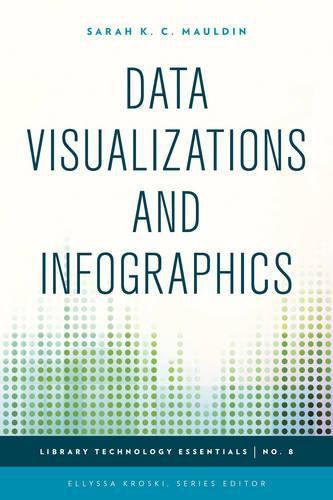
Graphics which visually represent data or complex ideas are oftentimes easier for people to understand and digest than standalone statistics. A map shaded with different colors to represent religious affiliations or income levels enables researchers to quickly identify trends and patterns. New free tools and applications offer librarians the opportunity to organize and manipulate data to quickly create these helpful graphics. Learn how to overlay data sets on maps, create infographics for library services and instruction, use mindmapping for group brainstorming sessions, produce detailed timelines, process flowcharts, diagrams, and much more in this complete how-to-guidebook.
This complete how-to guidebook provides you with the tools and inspiration you need to use infographics and data visualization techniques in your library to knock your audience’s socks off as you tell your story in a visual format that can be consumed and understood at a glance.
You will learn how to: *use the tools you already have to create a simple infographic; *create a library services infographic using Piktochart; *create instructional infographics with Easel.ly; *create interactive timelines; mindmap your brainstorming meetings; *create library flowcharts and diagrams using Creately; *create interactive maps with imported data; and *create complex data visualizations.
$9.00 standard shipping within Australia
FREE standard shipping within Australia for orders over $100.00
Express & International shipping calculated at checkout
Graphics which visually represent data or complex ideas are oftentimes easier for people to understand and digest than standalone statistics. A map shaded with different colors to represent religious affiliations or income levels enables researchers to quickly identify trends and patterns. New free tools and applications offer librarians the opportunity to organize and manipulate data to quickly create these helpful graphics. Learn how to overlay data sets on maps, create infographics for library services and instruction, use mindmapping for group brainstorming sessions, produce detailed timelines, process flowcharts, diagrams, and much more in this complete how-to-guidebook.
This complete how-to guidebook provides you with the tools and inspiration you need to use infographics and data visualization techniques in your library to knock your audience’s socks off as you tell your story in a visual format that can be consumed and understood at a glance.
You will learn how to: *use the tools you already have to create a simple infographic; *create a library services infographic using Piktochart; *create instructional infographics with Easel.ly; *create interactive timelines; mindmap your brainstorming meetings; *create library flowcharts and diagrams using Creately; *create interactive maps with imported data; and *create complex data visualizations.