Readings Newsletter
Become a Readings Member to make your shopping experience even easier.
Sign in or sign up for free!
You’re not far away from qualifying for FREE standard shipping within Australia
You’ve qualified for FREE standard shipping within Australia
The cart is loading…


Simplify stats and learn how to graph, analyze, and interpret data the easy way
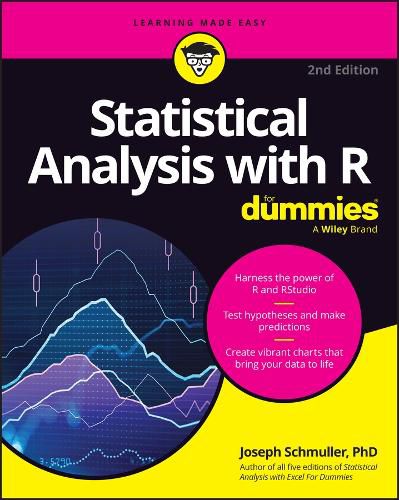
Statistical Analysis with R For Dummies makes stats approachable by combining clear explanations with practical applications. You'll learn how to download and use R and RStudio-two free, open-source tools-to learn statistics concepts, create graphs, test hypotheses, and draw meaningful conclusions. Get started by learning the basics of statistics and R, calculate descriptive statistics, and use inferential statistics to test hypotheses. Then, visualize it all with graphs and charts. This Dummies guide is your well-marked path to sailing through statistics.
Get clear explanations of the basics of statistics and data analysis Learn how to analyze and visualize data with R, step by step Create charts, graphs, and summaries to interpret results Explore hypothesis testing, and prediction techniques
This is the perfect introduction to R for students, professionals, and the stat-curious.
$9.00 standard shipping within Australia
FREE standard shipping within Australia for orders over $100.00
Express & International shipping calculated at checkout
Simplify stats and learn how to graph, analyze, and interpret data the easy way
Statistical Analysis with R For Dummies makes stats approachable by combining clear explanations with practical applications. You'll learn how to download and use R and RStudio-two free, open-source tools-to learn statistics concepts, create graphs, test hypotheses, and draw meaningful conclusions. Get started by learning the basics of statistics and R, calculate descriptive statistics, and use inferential statistics to test hypotheses. Then, visualize it all with graphs and charts. This Dummies guide is your well-marked path to sailing through statistics.
Get clear explanations of the basics of statistics and data analysis Learn how to analyze and visualize data with R, step by step Create charts, graphs, and summaries to interpret results Explore hypothesis testing, and prediction techniques
This is the perfect introduction to R for students, professionals, and the stat-curious.