Readings Newsletter
Become a Readings Member to make your shopping experience even easier.
Sign in or sign up for free!
You’re not far away from qualifying for FREE standard shipping within Australia
You’ve qualified for FREE standard shipping within Australia
The cart is loading…


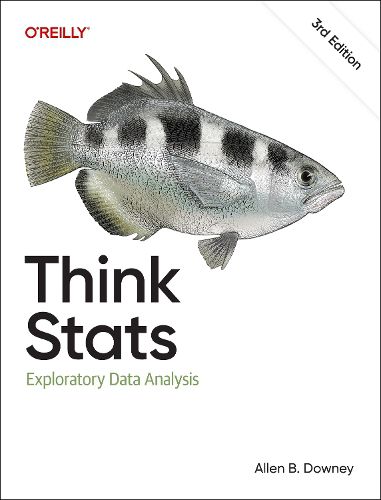
If you know how to program, you have the skills to turn data into knowledge, using the tools of probability and statistics. This thoroughly revised edition shows you how to perform statistical analysis computationally, rather than mathematically, with programs written in Python. Through practical examples and exercises that follow a collection of real-world datasets, you'll learn the entire process of exploratory data analysis--from collecting data and generating statistics to identifying patterns and testing hypotheses.
Whether you're a data scientist, software engineer, or data enthusiast, you'll get up to speed on commonly used tools including NumPy, SciPy, and Pandas as you explore distributions, relationships between variables, visualization, and many other concepts. And this updated guide has been fully moved into Jupyter notebooks, so you can read the text, run the code, and work on exercises all in one place.
Analyze data distributions and visualize patterns using Python libraries Improve predictions and insights with regression models Dive into specialized topics like time series analysis and survival analysis Integrate statistical techniques and tools for validation, inference, and more Communicate findings effectively with enhanced data visualization practices Troubleshoot common data analysis challenges Boost reproducibility and collaboration in data analysis projects with interactive notebooks
$9.00 standard shipping within Australia
FREE standard shipping within Australia for orders over $100.00
Express & International shipping calculated at checkout
If you know how to program, you have the skills to turn data into knowledge, using the tools of probability and statistics. This thoroughly revised edition shows you how to perform statistical analysis computationally, rather than mathematically, with programs written in Python. Through practical examples and exercises that follow a collection of real-world datasets, you'll learn the entire process of exploratory data analysis--from collecting data and generating statistics to identifying patterns and testing hypotheses.
Whether you're a data scientist, software engineer, or data enthusiast, you'll get up to speed on commonly used tools including NumPy, SciPy, and Pandas as you explore distributions, relationships between variables, visualization, and many other concepts. And this updated guide has been fully moved into Jupyter notebooks, so you can read the text, run the code, and work on exercises all in one place.
Analyze data distributions and visualize patterns using Python libraries Improve predictions and insights with regression models Dive into specialized topics like time series analysis and survival analysis Integrate statistical techniques and tools for validation, inference, and more Communicate findings effectively with enhanced data visualization practices Troubleshoot common data analysis challenges Boost reproducibility and collaboration in data analysis projects with interactive notebooks