Readings Newsletter
Become a Readings Member to make your shopping experience even easier.
Sign in or sign up for free!
You’re not far away from qualifying for FREE standard shipping within Australia
You’ve qualified for FREE standard shipping within Australia
The cart is loading…


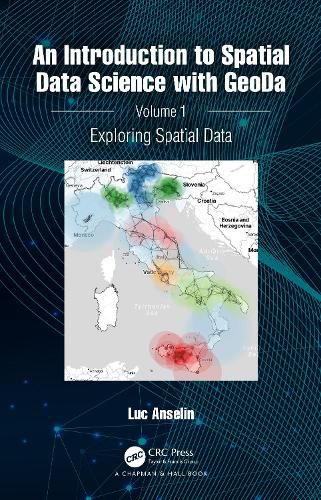
This book is the first in a two-volume series that introduces the field of spatial data science. It offers an accessible overview of the methodology of exploratory spatial data analysis. It also constitutes the definitive user's guide for the widely adopted GeoDa open-source software for spatial analysis. Leveraging a large number of real-world empirical illustrations, readers will gain an understanding of the main concepts and techniques, using dynamic graphics for thematic mapping, statistical graphing, and, most centrally, the analysis of spatial autocorrelation. Key to this analysis is the concept of local indicators of spatial association, pioneered by the author and recently extended to the analysis of multivariate data.
The focus of the book is on intuitive methods to discover interesting patterns in spatial data. It offers a progression from basic data manipulation through description and exploration to the identification of clusters and outliers by means of local spatial autocorrelation analysis. A distinctive approach is to spatialize intrinsically non-spatial methods by means of linking and brushing with a range of map representations, including several that are unique to the GeoDa software. The book also represents the most in-depth treatment of local spatial autocorrelation and its visualization and interpretation by means of GeoDa.
The book is intended for readers interested in going beyond simple mapping of geographical data to gain insight into interesting patterns. Some basic familiarity with statistical concepts is assumed, but no previous knowledge of GIS or mapping is required.
Key Features:
This book is both useful as a reference for the software and as a text for students and researchers of spatial data science.
$9.00 standard shipping within Australia
FREE standard shipping within Australia for orders over $100.00
Express & International shipping calculated at checkout
This book is the first in a two-volume series that introduces the field of spatial data science. It offers an accessible overview of the methodology of exploratory spatial data analysis. It also constitutes the definitive user's guide for the widely adopted GeoDa open-source software for spatial analysis. Leveraging a large number of real-world empirical illustrations, readers will gain an understanding of the main concepts and techniques, using dynamic graphics for thematic mapping, statistical graphing, and, most centrally, the analysis of spatial autocorrelation. Key to this analysis is the concept of local indicators of spatial association, pioneered by the author and recently extended to the analysis of multivariate data.
The focus of the book is on intuitive methods to discover interesting patterns in spatial data. It offers a progression from basic data manipulation through description and exploration to the identification of clusters and outliers by means of local spatial autocorrelation analysis. A distinctive approach is to spatialize intrinsically non-spatial methods by means of linking and brushing with a range of map representations, including several that are unique to the GeoDa software. The book also represents the most in-depth treatment of local spatial autocorrelation and its visualization and interpretation by means of GeoDa.
The book is intended for readers interested in going beyond simple mapping of geographical data to gain insight into interesting patterns. Some basic familiarity with statistical concepts is assumed, but no previous knowledge of GIS or mapping is required.
Key Features:
This book is both useful as a reference for the software and as a text for students and researchers of spatial data science.