Readings Newsletter
Become a Readings Member to make your shopping experience even easier.
Sign in or sign up for free!
You’re not far away from qualifying for FREE standard shipping within Australia
You’ve qualified for FREE standard shipping within Australia
The cart is loading…


This title is printed to order. This book may have been self-published. If so, we cannot guarantee the quality of the content. In the main most books will have gone through the editing process however some may not. We therefore suggest that you be aware of this before ordering this book. If in doubt check either the author or publisher’s details as we are unable to accept any returns unless they are faulty. Please contact us if you have any questions.
How can applied researchers present and analyze their research data more effectively? By applying the techniques described in this volume, social scientists will be able to make the most efficient use of their data as well as making it more accessible. The book uses many examples to illustrate effective graphical displays of data and offers practical techniques for producing graphs. Beginning with a discussion of what has been learned from visual perception research that relates to graphing data, the book then covers: the use of graphs for summarizing data; the display of multiple units; ways to improve tabular displays; graphical alternatives to tables; two variable scatterplots as graphical support for correlation and regression; how to show variation and the summary statistics together; and how to create more effective legends and titles on a graphical display.
$9.00 standard shipping within Australia
FREE standard shipping within Australia for orders over $100.00
Express & International shipping calculated at checkout
This title is printed to order. This book may have been self-published. If so, we cannot guarantee the quality of the content. In the main most books will have gone through the editing process however some may not. We therefore suggest that you be aware of this before ordering this book. If in doubt check either the author or publisher’s details as we are unable to accept any returns unless they are faulty. Please contact us if you have any questions.
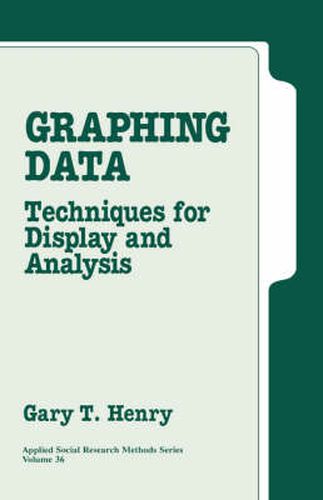
How can applied researchers present and analyze their research data more effectively? By applying the techniques described in this volume, social scientists will be able to make the most efficient use of their data as well as making it more accessible. The book uses many examples to illustrate effective graphical displays of data and offers practical techniques for producing graphs. Beginning with a discussion of what has been learned from visual perception research that relates to graphing data, the book then covers: the use of graphs for summarizing data; the display of multiple units; ways to improve tabular displays; graphical alternatives to tables; two variable scatterplots as graphical support for correlation and regression; how to show variation and the summary statistics together; and how to create more effective legends and titles on a graphical display.