Readings Newsletter
Become a Readings Member to make your shopping experience even easier.
Sign in or sign up for free!
You’re not far away from qualifying for FREE standard shipping within Australia
You’ve qualified for FREE standard shipping within Australia
The cart is loading…


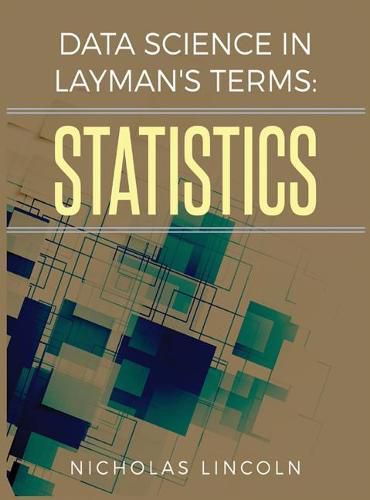
There are countless blogs, courses, and tutorials out there that explain statistical concepts, but only a book can provide a complete roadmap to understanding statistics. Textbooks, however, tend to focus on theory and mathematical proofs, rather than practical or applied statistics. Data Science in Layman’s Terms: Statistics strikes a balance between an easy-reading tutorial, and a theory intensive textbook. It offers a complete roadmap for understanding statistics. The concepts in this book are first explained in plain English, and are then supported by visuals and equations. The material is arranged linearly from the simple ideas presented in the first few chapters to the complex ideas presented in later chapters. Each chapter builds upon the information from previous chapters. Every chapter contains code that shows how to implement the concepts, in both R and Python.
The book begins by explaining basic statistical concepts and descriptive statistics. It then explains linear and logistic regression, and how optimization plays a central role in statistics. The book then explains statistical tests for comparing group means, such as ANOVA and MANOVA. Both parametric and non-parametric tests are described. Concepts to expand the flexibility of statistical analysis, like regularization, resampling, dimension reduction, and nonlinear modeling, are also explained. Later in the book, the Bayesian approach to statistics is described. The last chapters cover time series and signals analysis. All of these concepts are applied in R and Python at the end of each chapter.
In this book, you will
- Learn how to build statistical models to predict continuous, ordinal, and categorical variables.
- Use time series modeling to forecast stock prices and volatility.
- Use Fitbit data to model calories burned, and find out how many steps it takes to burn 1 calorie.
- Create a fake text or Tweet generator that produces text that is close enough to normal speech to seem believable.
- Detect outliers, identify potentially fraudulent data, and detect change points in time series data.
- Learn how to discover gravitational waves in signal data from the Laser Interferometer Gravitational-Wave Observatory.
The GitHub repository accompanying this book can be found at: https: //github.com/nlinc1905/dsilt-stats-code
$9.00 standard shipping within Australia
FREE standard shipping within Australia for orders over $100.00
Express & International shipping calculated at checkout
There are countless blogs, courses, and tutorials out there that explain statistical concepts, but only a book can provide a complete roadmap to understanding statistics. Textbooks, however, tend to focus on theory and mathematical proofs, rather than practical or applied statistics. Data Science in Layman’s Terms: Statistics strikes a balance between an easy-reading tutorial, and a theory intensive textbook. It offers a complete roadmap for understanding statistics. The concepts in this book are first explained in plain English, and are then supported by visuals and equations. The material is arranged linearly from the simple ideas presented in the first few chapters to the complex ideas presented in later chapters. Each chapter builds upon the information from previous chapters. Every chapter contains code that shows how to implement the concepts, in both R and Python.
The book begins by explaining basic statistical concepts and descriptive statistics. It then explains linear and logistic regression, and how optimization plays a central role in statistics. The book then explains statistical tests for comparing group means, such as ANOVA and MANOVA. Both parametric and non-parametric tests are described. Concepts to expand the flexibility of statistical analysis, like regularization, resampling, dimension reduction, and nonlinear modeling, are also explained. Later in the book, the Bayesian approach to statistics is described. The last chapters cover time series and signals analysis. All of these concepts are applied in R and Python at the end of each chapter.
In this book, you will
- Learn how to build statistical models to predict continuous, ordinal, and categorical variables.
- Use time series modeling to forecast stock prices and volatility.
- Use Fitbit data to model calories burned, and find out how many steps it takes to burn 1 calorie.
- Create a fake text or Tweet generator that produces text that is close enough to normal speech to seem believable.
- Detect outliers, identify potentially fraudulent data, and detect change points in time series data.
- Learn how to discover gravitational waves in signal data from the Laser Interferometer Gravitational-Wave Observatory.
The GitHub repository accompanying this book can be found at: https: //github.com/nlinc1905/dsilt-stats-code