Readings Newsletter
Become a Readings Member to make your shopping experience even easier.
Sign in or sign up for free!
You’re not far away from qualifying for FREE standard shipping within Australia
You’ve qualified for FREE standard shipping within Australia
The cart is loading…


This title is printed to order. This book may have been self-published. If so, we cannot guarantee the quality of the content. In the main most books will have gone through the editing process however some may not. We therefore suggest that you be aware of this before ordering this book. If in doubt check either the author or publisher’s details as we are unable to accept any returns unless they are faulty. Please contact us if you have any questions.
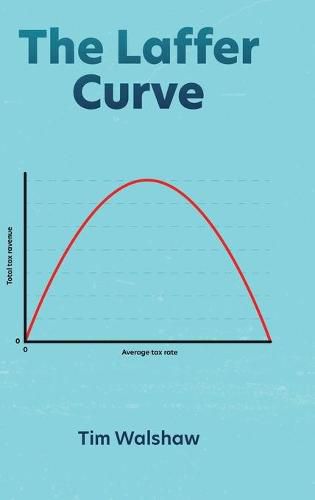
What is the maximum possible average tax rate before tax revenue begins to decline? This is described by the Laffer Curve. On a chart where the ‘x’ axis is the average tax rate and the ‘y’ axis is the total tax revenue, you can draw an upside down curve that has a peak at some point. Past that point, tax revenue declines. There is no dispute among economists about the correctness of this theory. The dispute among economists is whether the Laffer Curve exists in practice. This book estimates a mathematical formula for the Laffer Curve, and with that, estimates the maximum possible average tax rate for the USA at a certain date. This information is very useful for policy purposes.
$9.00 standard shipping within Australia
FREE standard shipping within Australia for orders over $100.00
Express & International shipping calculated at checkout
This title is printed to order. This book may have been self-published. If so, we cannot guarantee the quality of the content. In the main most books will have gone through the editing process however some may not. We therefore suggest that you be aware of this before ordering this book. If in doubt check either the author or publisher’s details as we are unable to accept any returns unless they are faulty. Please contact us if you have any questions.
What is the maximum possible average tax rate before tax revenue begins to decline? This is described by the Laffer Curve. On a chart where the ‘x’ axis is the average tax rate and the ‘y’ axis is the total tax revenue, you can draw an upside down curve that has a peak at some point. Past that point, tax revenue declines. There is no dispute among economists about the correctness of this theory. The dispute among economists is whether the Laffer Curve exists in practice. This book estimates a mathematical formula for the Laffer Curve, and with that, estimates the maximum possible average tax rate for the USA at a certain date. This information is very useful for policy purposes.
Search our extensive online catalogue.
