Readings Newsletter
Become a Readings Member to make your shopping experience even easier.
Sign in or sign up for free!
You’re not far away from qualifying for FREE standard shipping within Australia
You’ve qualified for FREE standard shipping within Australia
The cart is loading…


This title is printed to order. This book may have been self-published. If so, we cannot guarantee the quality of the content. In the main most books will have gone through the editing process however some may not. We therefore suggest that you be aware of this before ordering this book. If in doubt check either the author or publisher’s details as we are unable to accept any returns unless they are faulty. Please contact us if you have any questions.
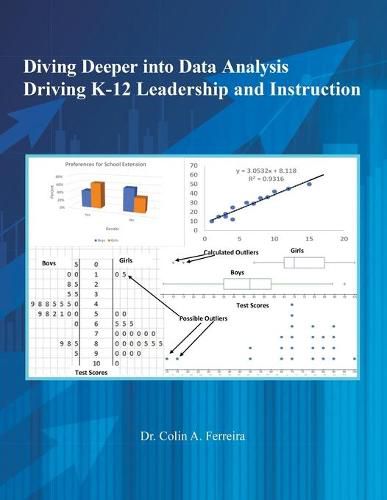
This textbook demystifies the complex Statistical calculations and difficulty in analyzing and interpreting assessment data by presenting simplified approaches for: - Understanding data types and using appropriate graphical and numerical forms to describe data. - Correctly reading and interpreting quantitative data and qualitative data presented in charts, tables, and graphs including pie charts, bar graphs, two-way tables, side-by-side bar graphs, segmented bar graphs, line graphs, histograms, dotplots, parallel boxplots, side-by-side stemplots, and scatter plots. - Correctly reading and interpreting quantitative data presented in numerical forms including mean, median, standard deviation, range, interquartile range, percentiles, quartiles, and standardized scores (z-scores). - Making data-driven decisions based on statistical calculations and interpretations. - Using the results of prudent data analysis to drive leadership and instruction. - Using the findings of extensive data analysis of assessment data to develop an innovative school improvement action plan.
$9.00 standard shipping within Australia
FREE standard shipping within Australia for orders over $100.00
Express & International shipping calculated at checkout
This title is printed to order. This book may have been self-published. If so, we cannot guarantee the quality of the content. In the main most books will have gone through the editing process however some may not. We therefore suggest that you be aware of this before ordering this book. If in doubt check either the author or publisher’s details as we are unable to accept any returns unless they are faulty. Please contact us if you have any questions.
This textbook demystifies the complex Statistical calculations and difficulty in analyzing and interpreting assessment data by presenting simplified approaches for: - Understanding data types and using appropriate graphical and numerical forms to describe data. - Correctly reading and interpreting quantitative data and qualitative data presented in charts, tables, and graphs including pie charts, bar graphs, two-way tables, side-by-side bar graphs, segmented bar graphs, line graphs, histograms, dotplots, parallel boxplots, side-by-side stemplots, and scatter plots. - Correctly reading and interpreting quantitative data presented in numerical forms including mean, median, standard deviation, range, interquartile range, percentiles, quartiles, and standardized scores (z-scores). - Making data-driven decisions based on statistical calculations and interpretations. - Using the results of prudent data analysis to drive leadership and instruction. - Using the findings of extensive data analysis of assessment data to develop an innovative school improvement action plan.